Binned distribution file
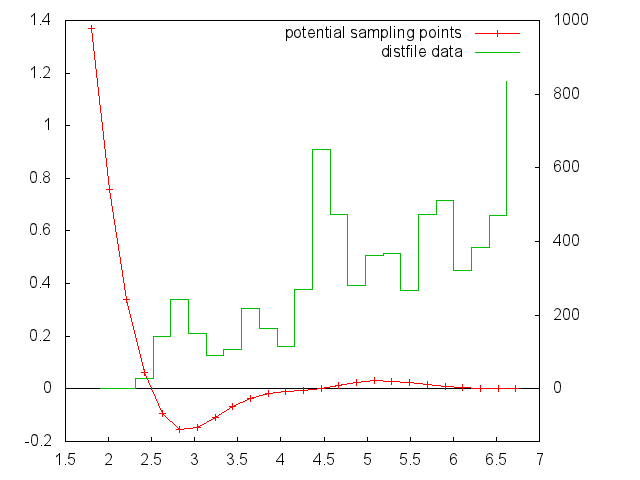
Information on how often each segment (between two sampling points) of the various functions is used in force calculation is printed to the file given by the parameter bindist_file.
To enable this feature, compile potfit with the –enable-bindist switch. This information can be useful to check if the sampling points of tabulated potentials have a reasonable density and/or distribution.
<span style="color:red">This option is incompatible with mpi parallelization and only available for tabulated potentials.</span>
In the output file you get a datapoint for every segment between two potential datapoints. Different potentials are separated by two newlines.
Example
If your potential would be defined by values at $r=1,2,3$ then you would get a distfile with values at $1.5$ and $2.5$ representing the two segments.
This is data from a binned distribution file combined with the plotpointfile to visualize the individual segments:
